New Orleans Real Estate Market Update — May 2026 | Rêve Realtors
<
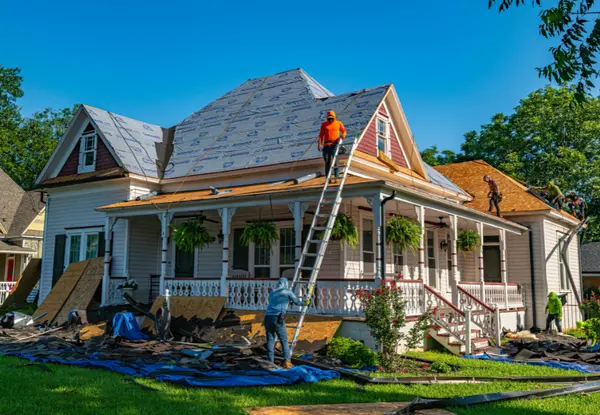
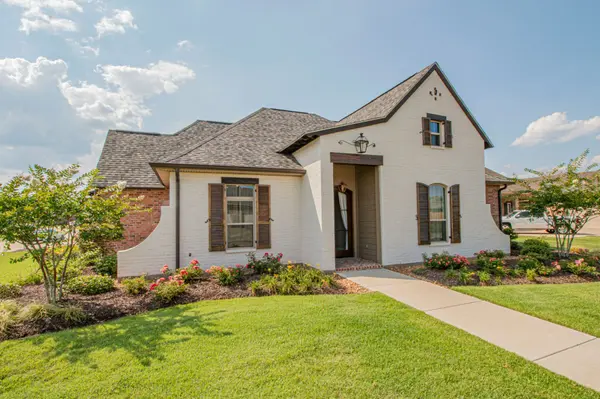
New Orleans found its balance this May. With 4.8 months of supply, the city is sitting squarely between a buyer's and seller's market — but the real story is how little is for sale. Active single family listings dropped 19.1% from a year ago, and that scarcity nudged the median sale price up 5.2% to $441,585. Homes are also moving faster, with average days on market down to 54. Here is how it broke down across the neighborhoods.
New Orleans Neighborhoods
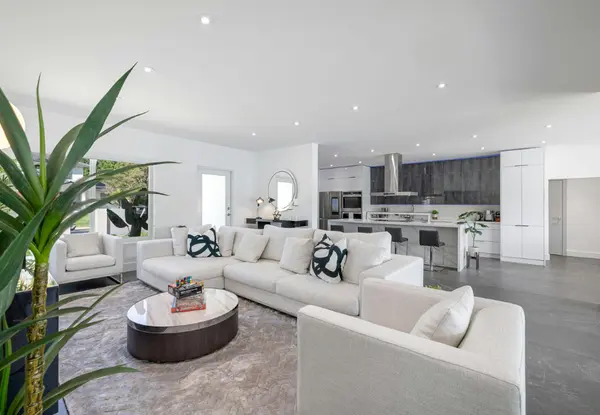
Uptown
| Metric | May 2026 | YoY Change |
| Median Sale Price | $633,219 | +10.9% |
| Price per Sq Ft | $335 | -4.0% |
| Avg Days on Market | 55 | +13 days |
| Active Listings | 180 | -28.9% |
| Months of Supply | 3.2 | — |
| Closed Sales | 57 | +23.9% |
| Pending Sales | 54 | -22.9% |
| Sale-to-List Ratio | 96.1% | — |
Uptown remains the heartbeat of New Orleans real estate. The median sale price rose 10.9% to $633,219, and 57 homes sold — nearly a quarter more than last May. With just 3.2 months of supply, this is a seller's neighborhood, and the homes drawing the most attention are the ones with the character buyers come to Uptown for in the first place.
Garden District / LGD
| Metric | May 2026 | YoY Change |
| Median Sale Price | $1,132,500 | +61.3% |
| Price per Sq Ft | $397 | +16.2% |
| Avg Days on Market | 20 | -65 days |
| Active Listings | 22 | -31.2% |
| Months of Supply | 5.5 | — |
| Closed Sales | 4 | -60.0% |
| Pending Sales | 4 | -20.0% |
| Sale-to-List Ratio | 100.3% | — |
The Garden District saw a small number of high-end homes trade in May, pushing the median above $1.1 million. With only four sales, that number reflects which specific homes sold more than a market-wide jump. The more telling signal: homes here sold in under 20 days, at full asking price. When the right Garden District property comes to market, it does not sit.
Mid-City / Bayou St. John
| Metric | May 2026 | YoY Change |
| Median Sale Price | $420,000 | +16.2% |
| Price per Sq Ft | $230 | -11.3% |
| Avg Days on Market | 43 | -24 days |
| Active Listings | 104 | -25.2% |
| Months of Supply | 4.2 | — |
| Closed Sales | 25 | +78.6% |
| Pending Sales | 20 | +25.0% |
| Sale-to-List Ratio | 96.2% | — |
Mid-City and Bayou St. John are having a moment. The median sale price climbed 16.2% to $420,000, and the number of homes sold nearly doubled from a year ago. Inventory tightened too, falling 25%. Buyers drawn to the area's bungalows, central location, and neighborhood feel are finding less to choose from and more competition when they do.
Gentilly
| Metric | May 2026 | YoY Change |
| Median Sale Price | $273,500 | 0.0% |
| Price per Sq Ft | $178 | +4.7% |
| Avg Days on Market | 48 | -12 days |
| Active Listings | 156 | -13.3% |
| Months of Supply | 4.5 | — |
| Closed Sales | 35 | +12.9% |
| Pending Sales | 30 | +36.4% |
| Sale-to-List Ratio | 98.9% | — |
Gentilly offered consistency this May. The median sale price held steady at $273,500, and 35 homes changed hands — up from a year ago — selling at nearly 99% of asking. For buyers looking for an attainable foothold in New Orleans without the bidding pressure of pricier neighborhoods, Gentilly continues to deliver.
Lakeview
| Metric | May 2026 | YoY Change |
| Median Sale Price | $541,000 | -14.3% |
| Price per Sq Ft | $235 | -12.2% |
| Avg Days on Market | 66 | 0 days |
| Active Listings | 88 | -43.2% |
| Months of Supply | 3.1 | — |
| Closed Sales | 28 | -22.2% |
| Pending Sales | 24 | -29.4% |
| Sale-to-List Ratio | 97.4% | — |
Lakeview's median sale price dipped to $541,000, but the number deserves context. Inventory here fell 43% from last year — the sharpest drop in the city — and with so few homes for sale, the mix of what sold shifted. With just 3.1 months of supply, Lakeview remains a competitive, demand-driven neighborhood, not a bargain hunter's market.
French Quarter / Tremé
| Metric | May 2026 | YoY Change |
| Median Sale Price | $428,750 | +156.0% |
| Price per Sq Ft | $292 | +111.3% |
| Avg Days on Market | 53 | -7 days |
| Active Listings | 60 | -42.9% |
| Months of Supply | 5.0 | — |
| Closed Sales | 12 | +300.0% |
| Pending Sales | 5 | -16.7% |
| Sale-to-List Ratio | 99.1% | — |
The French Quarter and Tremé trade mostly in condos and attached homes, so the fuller picture comes from all property types: a median of $417,500 across 27 sales, up 29.3% from last year. Inventory tightened, and demand for a foothold in the city's most historic core stayed strong. This is a market where buyers are paying for a one-of-a-kind address.
Marigny / Bywater
| Metric | May 2026 | YoY Change |
| Median Sale Price | $237,500 | +1.9% |
| Price per Sq Ft | $160 | +0.6% |
| Avg Days on Market | 93 | +32 days |
| Active Listings | 159 | -7.0% |
| Months of Supply | 9.4 | — |
| Closed Sales | 17 | -29.2% |
| Pending Sales | 11 | -52.2% |
| Sale-to-List Ratio | 95.6% | — |
The Marigny and Bywater moved at a more relaxed pace this May. Single family homes carried a median of $237,500, and with roughly nine months of supply, buyers here have something rare in New Orleans right now: time and room to negotiate. For buyers who love the area's color and want leverage, this is the moment.
CBD / Warehouse District
| Metric | May 2026 | YoY Change |
| Median Sale Price | $275,000 | +14.6% |
| Price per Sq Ft | $137 | -4.1% |
| Avg Days on Market | 30 | -290 days |
| Active Listings | 22 | -26.7% |
| Months of Supply | 22.0 | — |
| Closed Sales | 1 | 0.0% |
| Pending Sales | 0 | -100.0% |
| Sale-to-List Ratio | 88.7% | — |
Downtown living means condos, and the CBD and Warehouse District reflect that. Looking at all property types, the median was $300,000 across seven sales, up 25.8% from last year. With inventory running long at over 16 months of supply, buyers drawn to walkable downtown life have plenty to choose from and no reason to rush a decision.
Algiers
| Metric | May 2026 | YoY Change |
| Median Sale Price | $311,588 | +20.4% |
| Price per Sq Ft | $148 | +11.3% |
| Avg Days on Market | 41 | -24 days |
| Active Listings | 212 | +2.9% |
| Months of Supply | 6.2 | — |
| Closed Sales | 34 | +54.5% |
| Pending Sales | 39 | +39.3% |
| Sale-to-List Ratio | 97.3% | — |
Across the river, Algiers is quietly thriving. The median sale price jumped 20.4% to $311,588, and the number of homes sold rose more than 50% from last year. As prices climb on the East Bank, buyers are discovering that Algiers offers real value, historic charm in Algiers Point, and an easy commute downtown. It is one of the city's most compelling affordability stories right now.
New Orleans East
| Metric | May 2026 | YoY Change |
| Median Sale Price | $74,000 | -59.5% |
| Price per Sq Ft | $52 | -53.6% |
| Avg Days on Market | 57 | -23 days |
| Active Listings | 54 | +54.3% |
| Months of Supply | 10.8 | — |
| Closed Sales | 5 | -61.5% |
| Pending Sales | 8 | -11.1% |
| Sale-to-List Ratio | 86.9% | — |
New Orleans East showed a low median this May, but with only five sales, that figure reflects a handful of lower-priced homes rather than the neighborhood as a whole. The clearer signal is inventory: active listings rose 54% from last year, giving buyers genuine room to negotiate. For value-focused buyers willing to look east, the leverage is real.
Luxury Market — $500,000+
The $500K-and-up tier is the tightest segment in the city. Active luxury inventory dropped 30.4% year over year to 304 listings, months of supply compressed to 3.6, and well-positioned homes are selling at 97.2% of list in roughly 40 days. The median luxury sale held essentially flat at $759,200, up 1.9%. With fewer trophy listings competing, sellers who price to the current comp set are holding leverage — and buyers at this level need to move on the right home quickly.
Working With Rêve
Rêve Realtors is a locally owned brokerage with deep roots in New Orleans and the surrounding region. Our agents know these neighborhoods block by block — from Uptown to Algiers Point — and bring the kind of local market intelligence that matters when you are navigating one of the country's most distinctive real estate markets.
Connect With a Rêve AgentIf you have been waiting for the market to hand you a deal, this is not that market in New Orleans — but it is a healthy one. Prices are climbing at a steady, sustainable pace, homes are selling faster than they did a year ago, and inventory is tight enough that good listings get real attention. Whether you are buying or selling, the move right now is to be ready before you start. Our agents know these neighborhoods block by block, and that is the difference between watching the right home and getting it.
Clint LaCour
CEO, Rêve Realtors
Frequently Asked Questions
>
Categories
Recent Posts